|
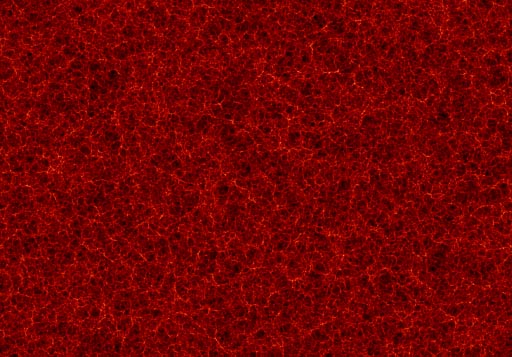
Explanation: We live in the era of humanity when most of our Universe is being mapped. To help understand these maps, astronomers computationally estimate the appearance of several possible candidate universes, to which maps of the real Universe can be compared. Pictured above is a slice through one of these artificial universes, displayed so that each part of the universe is seen at the same time after the Big Bang. The above map corresponds to an area nearly ten billion light years across. Highlighted in red are filaments that each contain thousands of galaxies, while darker regions are nearly devoid of galaxies. Our good-sized Milky Way Galaxy would hardly be visible on this map.
|
January February March April May June July August September October November December |
| ||||||||||||||||||||||||||||||||||||||||||||||||
NASA Web Site Statements, Warnings, and Disclaimers
NASA Official: Jay Norris. Specific rights apply.
A service of: LHEA at NASA / GSFC
& Michigan Tech. U.
Based on Astronomy Picture
Of the Day
Publications with keywords: simulation - universe
Publications with words: simulation - universe
See also:
- APOD: 2025 November 23 Á The Observable Universe
- APOD: 2024 December 1 Á Cosmic Latte: The Average Color of the Universe
- APOD: 2024 October 20 Á Dark Matter in a Simulated Universe
- APOD: 2024 July 1 Á Time Spiral
- APOD: 2023 December 31 Á Illustris: A Simulation of the Universe
- APOD: 2023 July 5 Á A Map of the Observable Universe
- APOD: 2023 June 29 Á A Message from the Gravitational Universe
