|
Credit & Copyright: Benjamin Winkel & the
HI4PI
Collaboration
Explanation:
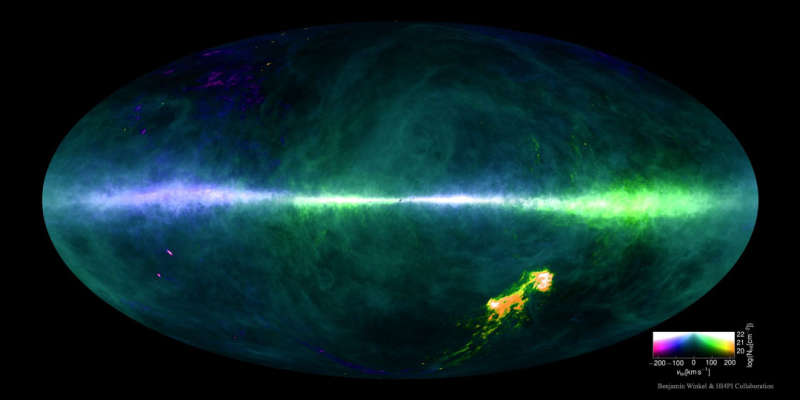
Where are the Milky Way's gas clouds and where are they going?
To help answer this question, a
new highest-resolution map
of the sky in the universe's
most abundant gas --
hydrogen -- has been completed and
recently released, along with its
underlying data.
Featured
above,
the all-sky map of hydrogen's
21-cm emission shows abundance with brightness and speed with color.
Low
radial speeds toward us
artificially colored blue and low radial speeds away colored green.
The band across the middle is the
plane of our Milky Way Galaxy,
while the bright spots on the lower right are the neighboring
Magellanic Clouds.
The HI4PI map collects data from over one million observations with the northern
Eiffelsberg 100-Meter Radio Telescope in
Germany and
the southern
Parkes 64-Meter Radio
Telescope in Australia,
also known as
"The Dish".
The details of the map not only better inform humanity about
star formation and
interstellar gas in our
Milky Way galaxy,
but also how much light
this local gas is likely to absorb when
observing the outside universe.
Many details on the map are
not yet well understood.
|
January February March April May June July August September October November December |
| |||||||||||||||||||||||||||||||||||||||||||||||||||||||
NASA Web Site Statements, Warnings, and Disclaimers
NASA Official: Jay Norris. Specific rights apply.
A service of: LHEA at NASA / GSFC
& Michigan Tech. U.
Based on Astronomy Picture
Of the Day
Publications with keywords: hydrogen - map
Publications with words: hydrogen - map
See also:
