|
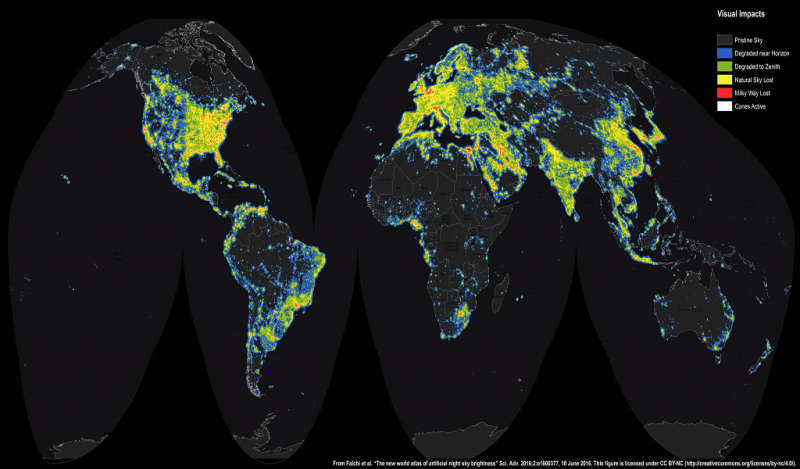
Explanation: How far are you from a naturally dark night sky? In increasing steps, this world map (medium | large) shows the effect of artificial night sky brightness on the visual appearance of the night sky. The brightness was modeled using high resolution satellite data and fit to thousands of night sky brightness measurements in recent work. Color-coded levels are compared to the natural sky brightness level for your location. For example, artificial sky brightness levels in yellow alter the natural appearance of the night sky. In red they hide the Milky Way in an artificial luminous fog. The results indicate that the historically common appearance of our galaxy at night is now lost for more than one-third of humanity. That includes 60% of Europeans and almost 80% of North Americans, along with inhabitants of other densely populated, light-polluted regions of planet Earth.
|
January February March April May June July August September October November December |
| ||||||||||||||||||||||||||||||||||||||||||||||||
NASA Web Site Statements, Warnings, and Disclaimers
NASA Official: Jay Norris. Specific rights apply.
A service of: LHEA at NASA / GSFC
& Michigan Tech. U.
Based on Astronomy Picture
Of the Day
Publications with keywords: night sky - light pollution
Publications with words: night sky - light pollution
See also:
- APOD: 2025 July 1 Á Eye Sky a Dragon
- APOD: 2025 April 23 Á An Almost Everything Sky
- APOD: 2024 September 11 Á A Night Sky over the Tatra Mountains
- APOD: 2023 August 15 Á A Triply Glowing Night Sky over Iceland
- Sunset to Sunrise over the Baltic Sea
- APOD: 2023 March 8 Á Artificial Night Sky Brightness
- An Artful Sky over Lofoten Islands
