 |
APEV
| [Overview] [Catalogue] [Multi-dip] |
This APEV tool uses data retrieved from appropriate sources and compiled by Alexei Dmitriev, Andrei Zhukov and Igor Veselovsky. Their work was supported by the INTAS-ESA projects 99-00727 and 03-51-6206 (coordinator: Volker Bothmer), RFBR, Astronomy state program and the Universities of Russia federal program. Their version of the interface can be found here. Creation of the metafiles describing their results has been performed by Alexander Prokhorov. Everything else has been designed and implemented by David Parunakian.
Description of the catalogue
- NN: Event index
- yyyy/mm/dd: Event date
- CH maps: Maps of coronal holes observed on the Sun four to two days before the geomagnetically disturbed day.
- DSF maps: H-α maps of solar filaments observed four to two days before the geomagnetically disturbed day [2].
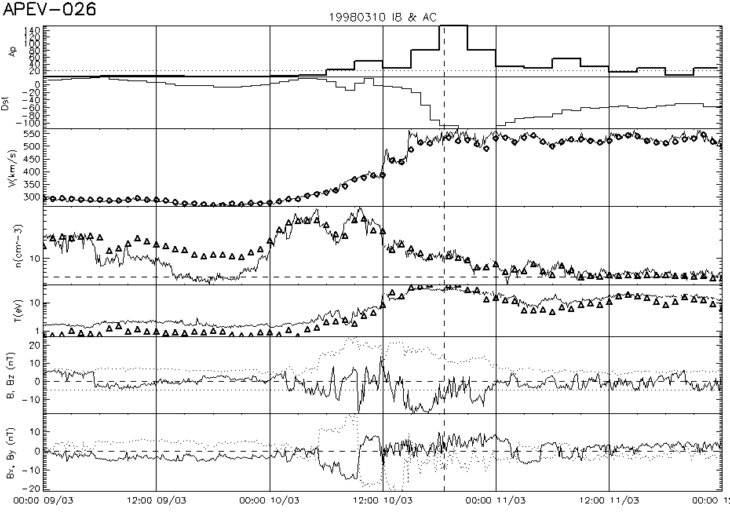
- N-d SW Conditions: Time profiles of the key geomagnetic (Ap and Dst indices), solar wind (velocity V, density n and temperature T) and IMF (B, Bx, By, Bz in GSM) parameters observed in the N day vicinity of the geomagnetic disturbed day.
- N-d Map of Solar Events: Map of solar surface events occurred within N day vicinity of the moment when the solar wind expansion (which causes the geomagnetic event) started.
- N-d List of Solar Events: Solar events occurred in N day vicinity of the moment when the solar wind expansion started [3].
Description of the time profiles of the key geomagnetic and solar wind parameters
Time profiles of the key geomagnetic parameters (Ap and Dst indices) are shown together with the key parameters of the solar wind (velocity V, density n and temperature T) and IMF (B, Bx, By, Bz in GSM coordinate system). This data allows to identify the interplanetary agent (CME, CIR, Erupted Filament etc.) triggering the magnetospheric disturbance. There are two kinds of plots: 3 days long (useful for searching fast processes) and 7 days long (userful for analysing global heliospheric and geomagnetic situation). The median day on the plots is mentioned in the select geomagnetically disturbed days list.

Geomagnetic activity dynamics is presented on the two top panels as time profiles of Ap and Dst indices. Geomagnetic data is obtained from WDC-C2 KYOTO Geomagnetic Data Service [4]. The vertical dashed line corresponds to the timestamp of the maximal Ap-index observed during a geomagnetically disturbed day.
The parameters of solar wind plasma (velocity V, density n and temperature T) are presented on the next three panels. Hourly average data from OMNIWeb [5] are indicated by circles (V) and triangles (n and T). High time resolution data on solar wind plasma is obtained from the Wind experiment [6] in 1997 and the ACE experiment [7] in 1998-2002 using the ISTP database [8]. On the bottom two panels IMF B, Bz (dotted and solid lines respectively) and Bx, By (solid and dotted lines respectively) are presented in the GSM coordinate system. The IMF data is obtained from ISTP database as well using the Wind experiment in 1997 and the ACE experiment in 1998-2002.
The probable time of the solar wind departure from the Sun was calculated using the maximal velocity measured within 12 hours before the maximal Ap-index detection. This instance is used to select the most probable solar events presented on 1d Map of Solar Events.
Description of solar event maps
The solar event maps show projections of different phenomena and events on the solar surface in rectangular helio-coordinates. The solar events shown have been observed during N-day interval around the given time point. The initial moment of solar wind expansion is restored using the maximal velocity observed within 12 hours before observed maximal Ap-index value during the geomagnetically disturbed day.
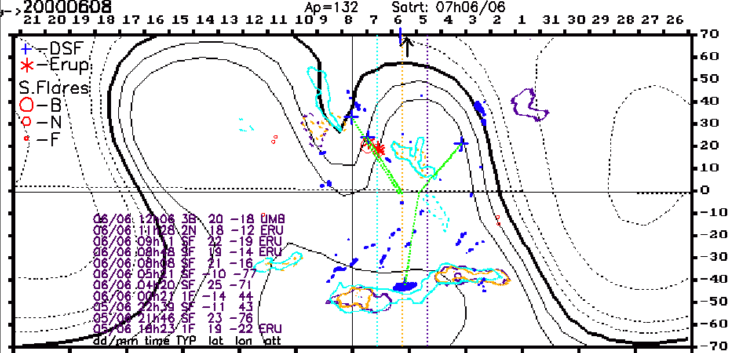
A 1-day map example:

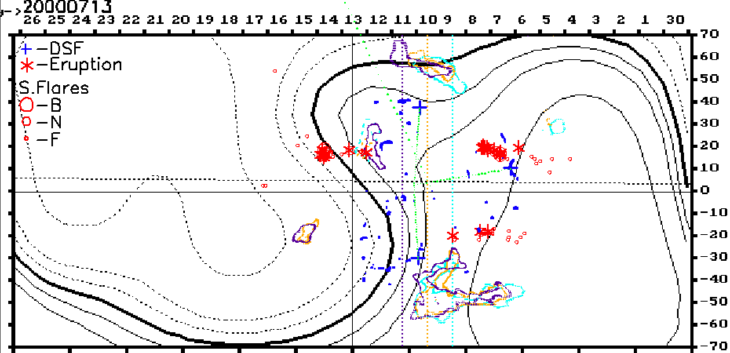
A 3-day map example:

In the upper left corner of the map the date of geomagnetic disturbed day is presented in the YYYYMMDD format. This date coincides with median day of the map marked by a solid vertical line (in the given example - 8 June, 2000). Vertical orange, violet and light blue dotted lines correspond to the noons of the day when the solar wind stream which caused the geomagnetic disturbance departed from the Sun and the days before and after. Horizontal black solid line is the solar equator. Horizontal dashed line is the Earth's orbit projection on the Sun. The following phenomena are presented on the map: coronal holes, filaments, solar flares and the distribution of the solar magnetic field on the source surface (2.5 solar radii).
- Coronal holes are indicated by irregular solid curves with colors according to the day of observation (light blue, orange and violet). Such representation allows to show clearly the temporal evolution of coronal holes. Initial information about coronal holes' locations is obtained from NSO Kitt Peak [1].
- Filaments are indicated by blue spots. Filament data obtained from Paris - Meudon Observatory [9].
- Disappearing filaments are indicated by blue crosses. The green dotted lines connect the positions of disappearing filaments with the Earth's projection on the Sun at the moment of the event.
- Solar flares are displayed by red circles with their radii depending on the H-α flare brightness: B (Brilliant - largest circles), N (Normal - medium circles) and F (Faint - smallest circles).
- Eruptive solar flares are indicated by red stars. The list of solar flares and their main characteristics is plotted in the bottom left part of the map.
- The distribution of the solar magnetic field on the source surface (black solid and dashed curves with different thickness) is used to show the position of the solar magnetic field neutral line (thick solid black line) associated with the heliospheric current sheet (HCS). The initial data is obtained from the Wilcox Solar Observatory [10] photospheric field measurements.
References
Developed in 2007. Copyright €й 2007 - 2016 Skobeltsyn Institute of Nuclear Physics Moscow State University Feedback