|
Peremennye Zvezdy (Variable Stars) 28, No. 7, 2008 Received 15 Juny; accepted 15 July.
|
Article in PDF |
THE INFRARED VARIATIONS OF CYG X-1 (V1357 CYG), 1995-2007
O.G. Taranova, V.I. Shenavrin, A.E. Nadjip
Sternberg Astronomical Institute, 13, University Ave., Moscow 119992, Russia. E-mail: taranova@sai.msu.ru
|
We present the results of our long-term ( |
1. INTRODUCTION
Cyg X-1 is one of the best-studied X-ray sources since its discovery in 1965 (Bowyer et al. 1965). Webster & Murdin (1972) identified the source with the O9.7Iab supergiant HD 226868 and found an orbital period of 5.6 days. On the basis of the analysis of data from the X-ray satellite UHURU, together with radio and optical observations, Tananbaum et al. (1972) suggested that the invisible component of the X-ray binary Cyg X-1 was a black hole. Optical variations of the supergiant were investigated by Lyuty (1972) and Lyuty et al. (1973). They calculated parameters of the binary, confirmed that the source Cyg X-1 was the first black-hole candidate, and explained variations of the optical component with its ellipsoidal shape, changing aspect during orbital motion.
Since then, the orbital period (![]() 5.6
5.6![]() ) was reliably
identified in the binary's brightness variations and the existence
of several periods (from dozens of days to hundreds of days; see,
for example, Kemp et al. 1978; Priedhorsky et al. 1983) was
suspected.
) was reliably
identified in the binary's brightness variations and the existence
of several periods (from dozens of days to hundreds of days; see,
for example, Kemp et al. 1978; Priedhorsky et al. 1983) was
suspected.
Despite extensive studies of Cyg X-1 in the recend decades, the IR
variability of the source was reliably established only in the
early 1990s (Leahy & Ananth 1992). The cited authors discovered
fluctuations of the J and K brightness with an amplitude of
0![]() 3 during the orbital motion and explained the near-IR
radiation from the system as due to the accretion disk.
3 during the orbital motion and explained the near-IR
radiation from the system as due to the accretion disk.
The first cycle of our JK photometry of Cyg X-1 was performed in 1984-1994 (Nadzhip et al., 1996). From the analysis of these observations together with optical photometry of Cyg X-1, we concluded that the variations of the binary's J and K brightness were ellipsoidal.
The results of our JK photometry of Cyg X-1 acquired in 1995-2007 are presented in this paper.
2. OBSERVATIONS
Our JK photometry of Cyg X-1 was performed at the 1.25-m
telescope of the Crimean Laboratory of the Sternberg Astronomical
Institute using a photometer with a liquid-nitrogen-cooled InSb
detector. The photometer was mounted at the Cassegrain focus of
the telescope; the exit aperture was ![]() . The star BS 7615
from the Johnson et al. (1966) catalog served as a photometric
standard. The results of our photometry of Cyg X-1 between June,
1995 and September, 2007 and their uncertainties are presented in
Table 1.
. The star BS 7615
from the Johnson et al. (1966) catalog served as a photometric
standard. The results of our photometry of Cyg X-1 between June,
1995 and September, 2007 and their uncertainties are presented in
Table 1.
3. RESULTS AND DISCUSSION
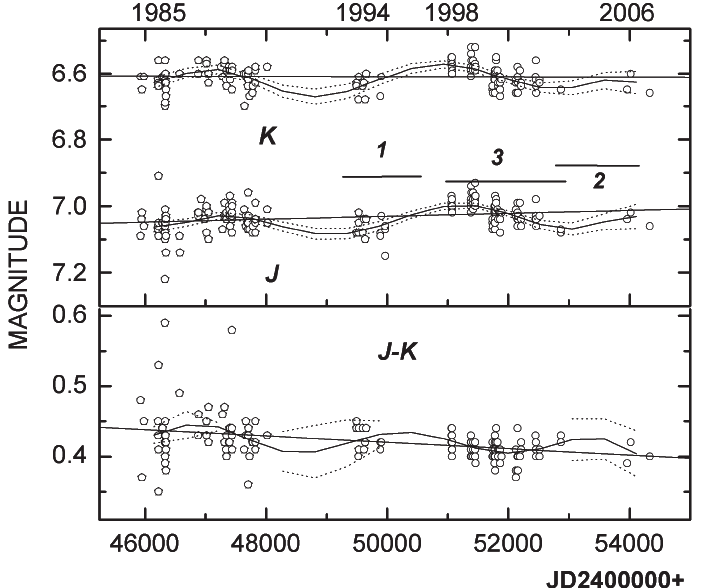 |
Fig. 1. The 1984–2007 JK light curves and J-K color curve of Cyg X-1. The straight lines are linear fits. The solid and dotted curves are fits to eighth-order polynomials and their confidence intervals. The lines 1, 2, and 3 show approximal time intervals of the maximum (line 1) and minimum (line 2) in the optical brightness and in the X-ray source activity (line 3). |
Characteristic Features of the JK Brightness Variations of Cyg X-1 in 1995-2007
Variations of the J and K magnitudes and J–K color of Cyg X-1 are presented in Fig. 1 for the whole time interval covered with our observations (1984-2007). The observations of 1984-1994 are plotted as asterisks; circles are observations of 1995-2007. The straight lines are linear fits of the observations. The results of our J and K photometry of 1984-1994 were discussed earlier (Nadzhip et al. 1996). The following qualitative features of the J and K magnitude and J–K color variations are apparent from Table 1 and Fig. 1:
-
the amplitudes of fluctuations of the J and K brightness
did not exceed 0
 2 during 1995-2007;
- the average K-brightness level almost did not vary between 1984 and 2007, but the J brightness has probably increased (see Fig. 1, straight lines). This has led to a decrease of the J–K color index in 2006-2007 compared to 1984-1985 (the straight line in the bottom part of Fig. 1).
It is easily apparent from the JK light curves (Fig. 1) that
the brightness of Cyg X-1 decreased during 1990-1994, then it
increased to a maximum near 2000 and again decreased to 2003. We
attempted to fit the J and K brightness fluctuations observed
in 1984-2007 to polynomials of different order (from 2 to 9). As
a result, the narrowest confidence intervals were found for curves
of the eighth order, they are shown in Fig. 1 as solid curves (the
dashed lines are boundaries of the confidence intervals). The
periodic component having a time scale of 4000-4300 days ( years) and an amplitude of
![]() in the
K filter is visible well enough.
in the
K filter is visible well enough.
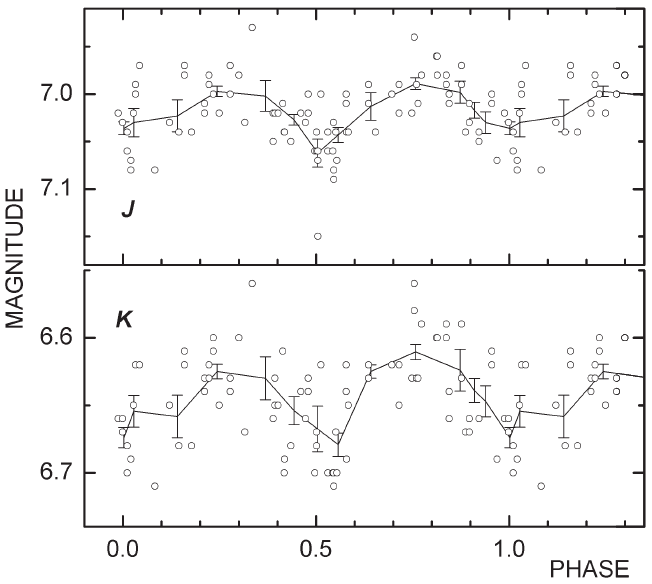 |
Fig. 2. The 1995–2007 JK light curves of Cyg X-1 folded with the orbital periods. The broken lines are for averaged values. |
In 1998-2004, an activity increase of the X-ray source was accompanied with a decrease of the binary's optical activity (Karitskaya et al. 2006). In the near-IR range, on the contrary, the activity of the X-ray source probably caused some increase both of the IR brightness and of the color temperature. It is clearly seen in Fig. 1, where the lines 1, 2, and 3 mark the approximate time intervals of the maximum (line 1) and minimum (line 2) in the optical brightness and in the X-ray source activity (line 3).
In other words, we can assume that there is a "long-term" component of the JK radiation with a variability time scale of about 11.5 years in the observed JK brightness variations of Cyg X-1 . The "long-term" component and the activity of the binary's X-ray component are probably interrelated.
Table 1. The JK photometry of V1357 Cyg (Cyg X-1),
1995-2007
| JD | J | K | JD | J | K | ||||
| (2440000+) | (2440000+) | ||||||||
| 9885.521 | 7.091 | 0.005 | 6.673 | 0.012 | 11774.338 | 7.010 | 0.005 | 6.624 | 0.007 |
| 9885.528 | 7.083 | 0.006 | 6.667 | 0.007 | 11774.345 | 7.005 | 0.005 | 6.600 | 0.007 |
| 9905.538 | 7.034 | 0.008 | 6.609 | 0.010 | 11775.354 | 7.015 | 0.005 | 6.606 | 0.007 |
| 9969.287 | 7.072 | 0.018 | 11776.392 | 7.017 | 0.006 | 6.591 | 0.003 | ||
| 9969.295 | 7.059 | 0.014 | 11776.400 | 7.014 | 0.006 | 6.595 | 0.004 | ||
| 9969.300 | 7.062 | 11777.382 | 7.025 | 0.007 | 6.619 | 0.005 | |||
| 11063.339 | 6.972 | 0.011 | 6.549 | 0.010 | 11777.390 | 7.050 | 0.006 | 6.618 | 0.007 |
| 11063.346 | 6.991 | 0.012 | 6.549 | 0.009 | 11778.310 | 7.066 | 0.005 | 6.657 | 0.003 |
| 11065.339 | 6.995 | 0.014 | 6.566 | 0.011 | 11779.395 | 7.015 | 0.009 | 6.591 | 0.007 |
| 11065.346 | 7.002 | 0.012 | 6.561 | 0.012 | 11780.367 | 7.047 | 0.006 | 6.620 | 0.008 |
| 11066.347 | 7.007 | 0.018 | 6.574 | 0.009 | 11780.368 | 7.036 | 0.010 | 6.622 | 0.007 |
| 11066.355 | 7.012 | 0.017 | 6.574 | 0.010 | 11782.363 | 6.973 | 0.009 | 6.593 | 0.016 |
| 11067.264 | 6.995 | 0.015 | 6.577 | 0.011 | 11782.370 | 7.005 | 0.011 | 6.599 | 0.009 |
| 11067.270 | 6.997 | 0.014 | 6.597 | 0.012 | 11802.298 | 6.987 | 0.007 | 6.547 | 0.007 |
| 11067.277 | 7.009 | 0.013 | 6.603 | 0.009 | 11802.305 | 6.984 | 0.007 | 6.557 | 0.005 |
| 11068.356 | 6.975 | 0.015 | 6.549 | 0.017 | 11824.283 | 7.006 | 0.007 | 6.591 | 0.004 |
| 11068.363 | 6.981 | 0.011 | 6.551 | 0.015 | 11832.202 | 7.041 | 0.005 | 6.636 | 0.006 |
| 11069.374 | 7.011 | 0.017 | 6.584 | 0.014 | 11834.298 | 7.035 | 0.006 | 6.626 | 0.008 |
| 11069.380 | 6.997 | 0.015 | 6.572 | 0.008 | 11850.258 | 7.022 | 0.006 | 6.614 | 0.007 |
| 11069.387 | 6.576 | 0.012 | 11864.178 | 7.035 | 0.004 | 6.634 | 0.007 | ||
| 11072.316 | 7.005 | 0.008 | 6.589 | 0.014 | 11865.270 | 7.075 | 0.007 | 6.673 | 0.010 |
| 11072.323 | 7.017 | 0.008 | 6.595 | 0.012 | 11866.208 | 7.020 | 0.005 | 6.607 | 0.006 |
| 11383.403 | 6.989 | 0.006 | 6.584 | 0.006 | 11867.152 | 7.045 | 0.007 | 6.649 | 0.003 |
| 11383.410 | 7.000 | 0.008 | 6.584 | 0.014 | 11887.139 | 7.023 | 0.010 | 6.616 | 0.006 |
| 11383.417 | 6.989 | 0.006 | 6.578 | 0.013 | 12125.448 | 7.034 | 0.009 | 6.655 | 0.012 |
| 11384.466 | 6.980 | 0.009 | 6.580 | 0.008 | 12127.417 | 7.014 | 0.010 | 6.627 | 0.012 |
| 11384.474 | 6.986 | 0.010 | 6.589 | 0.006 | 12127.425 | 7.029 | 0.015 | 6.618 | 0.013 |
| 11385.422 | 7.020 | 0.009 | 6.589 | 0.029 | 12153.366 | 7.060 | 0.009 | 6.657 | 0.008 |
| 11385.430 | 7.019 | 0.018 | 6.612 | 0.013 | 12153.374 | 7.043 | 0.008 | 6.657 | 0.010 |
| 11387.445 | 6.941 | 0.007 | 6.524 | 0.012 | 12154.396 | 6.994 | 0.008 | 6.614 | 0.009 |
| 11387.452 | 6.943 | 0.009 | 6.536 | 0.013 | 12154.403 | 7.023 | 0.009 | 6.582 | 0.007 |
| 11393.362 | 6.960 | 0.013 | 6.558 | 0.012 | 12158.336 | 7.042 | 0.011 | 6.663 | 0.009 |
| 11393.370 | 6.564 | 0.011 | 12163.365 | 7.027 | 0.008 | 6.631 | 0.006 | ||
| 11420.377 | 6.993 | 0.004 | 6.584 | 0.017 | 12188.251 | 6.994 | 0.008 | 6.590 | 0.008 |
| 11420.384 | 7.008 | 0.005 | 6.592 | 0.012 | 12209.205 | 7.061 | 0.002 | 6.637 | 0.003 |
| 11421.372 | 6.978 | 0.007 | 6.563 | 0.010 | 12209.210 | 7.041 | 0.004 | 6.631 | 0.003 |
| 11421.380 | 6.962 | 0.008 | 6.560 | 0.010 | 12450.456 | 7.035 | 0.013 | 6.611 | 0.012 |
| 11451.304 | 6.977 | 0.008 | 6.579 | 0.007 | 12454.463 | 6.975 | 0.011 | 6.563 | 0.007 |
| 11451.310 | 6.966 | 0.012 | 6.573 | 0.007 | 12455.434 | 7.028 | 0.008 | 6.625 | 0.015 |
| 11452.290 | 6.928 | 0.008 | 6.525 | 0.005 | 12456.448 | 7.044 | 0.018 | ||
| 11452.297 | 6.927 | 0.008 | 6.519 | 0.008 | 12458.444 | 7.045 | 0.008 | 6.644 | 0.018 |
| 11453.288 | 6.996 | 0.008 | 6.575 | 0.009 | 12458.450 | 7.061 | 0.010 | 6.661 | 0.010 |
| 11454.319 | 7.002 | 0.010 | 6.585 | 0.010 | 12514.377 | 7.032 | 0.010 | 6.623 | 0.011 |
| 11455.326 | 6.989 | 0.006 | 6.594 | 0.013 | 12514.385 | 7.031 | 0.011 | 6.627 | 0.010 |
| 11456.255 | 6.971 | 0.018 | 6.577 | 0.009 | 12867.288 | 7.085 | 0.007 | 6.648 | 0.009 |
| 11738.444 | 7.048 | 0.009 | 6.635 | 0.007 | 12867.297 | 7.074 | 0.007 | 6.652 | 0.005 |
| 11738.450 | 7.049 | 0.009 | 6.645 | 0.009 | 13962.376 | 7.045 | 0.006 | 6.651 | 0.008 |
| 11741.431 | 7.073 | 0.010 | 6.652 | 0.013 | 14023.319 | 7.023 | 0.009 | 6.604 | 0.008 |
| 11742.418 | 7.043 | 0.007 | 6.645 | 0.006 | 14337.372 | 7.057 | 0.008 | 6.655 | 0.004 |
| 11744.390 | 7.055 | 0.011 | 6.661 | 0.008 |
The average J and K magnitudes and J–K color indices of Cyg X-1 for some intervals of our observations (1995-2007, 1984-1994, and 1984-2007) are collected in Table 2. The standard errors (se) for average magnitudes, maximal and minimal magnitudes, and numbers of averaged values (N) are given. It follows from Table 2 that the source became brighter (its JK brightness increased) and hotter (its J–K color index decreased) during 1995-2007, compared to 1984-1994.
Table 2. The mean JK
magnitudes and J–K color index
for several intervals of observations of Cyg X-1 (1984-2007)
| Parameter | Mean | se | Max | Min | |
| 1995-2007 | |||||
| J | 7.021 | 0.004 | 6.93 | 7.15 | 110 |
| K | 6.606 | 0.004 | 6.52 | 6.68 | 107 |
| J–K | 0.412 | 0.001 | 0.37 | 0.44 | 105 |
| 1984-1994 | |||||
| J | 7.046 | 0.005 | 6.91 | 7.22 | 83 |
| K | 6.612 | 0.005 | 6.44 | 6.70 | 73 |
| J–K | 0.433 | 0.004 | 0.35 | 0.59 | 70 |
| 1984-2007 | |||||
| J | 7.032 | 0.003 | 6.91 | 7.22 | 193 |
| K | 6.608 | 0.003 | 6.44 | 6.70 | 180 |
| J–K | 0.420 | 0.002 | 0.35 | 0.59 | 175 |
Variations of JK Magnitudes and J–K Color of Cyg X-1 in the Course of Orbital Motion
Figure 2 displays variations of the J and K brightness of Cyg X-1 versus the orbital phase, from observations of 1995-2007. The broken lines are for averaged values (the error bars are standard errors). Averaging was performed for a phase bin width about 0.07. Phases were calculated with the elements (Brocksopp et al. 1999):
The long-term component in the JK brightness variations (Fig. 1)
was treated as a trend in JK magnitudes for observations of
1995-2007. Improved relations of the J and K magnitudes and
J–K color on the orbital phase were derived after removing the
trend. Figure 3 exhibits the final orbital J and K light
curves. The calculated relations are plotted as dashed curves,
they correspond to minimal errors. The vertical bars are standard
errors, which are
![]() ,
,
![]() .
The orbital JK light curves plotted in Fig. 3 as solid
curves are from Nadzhip et al. (1996).
.
The orbital JK light curves plotted in Fig. 3 as solid
curves are from Nadzhip et al. (1996).
The averaged JK magnitudes and J–K color indices for
different orbital phases (near minima and quadratures in
1995-2007), without and with correction for the long-term
variation component of the JK radiation, are presented in
Table 3 (a, b). In the Table, m are observed magnitudes; se,
standard errors; ![]() , average phases; N, numbers of
averaged data points.
, average phases; N, numbers of
averaged data points.
Table 3. The mean JK magnitudes and color indices near orbital minima and quadratures of Cyg X-1 (1995-2007)
a. No correction for long-term variations of the JK brightness
| N = 16 | N = 11 | N = 16 | N = 13 | |||||
| m | se | m | se | m | se | m | se | |
| J | 7.029 | 0.009 | 7.008 | 0.009 | 7.044 | 0.007 | 6.987 | 0.008 |
| K | 6.614 | 0.008 | 6.594 | 0.009 | 6.637 | 0.007 | 6.574 | 0.009 |
| J–K | 0.413 | 0.003 | 0.415 | 0.006 | 0.407 | 0.004 | 0.415 | 0.005 |
b. After correction for long-term variations of the JK brightness
| N = 16 | N = 11 | N = 16 | N = 13 | |||||
| m | se | m | se | m | se | m | se | |
| J | 7.088 | 0.005 | 7.071 | 0.006 | 7.107 | 0.006 | 6.987 | 0.008 |
| K | 6.653 | 0.004 | 6.641 | 0.007 | 6.682 | 0.007 | 7.055 | 0.007 |
| J–K | 0.439 | 0.003 | 0.436 | 0.005 | 0.429 | 0.004 | 7.055 | 0.007 |
It follows from the data of Table 3, Figs. 2 and 3 that the J
and K orbital brightness variations are almost sinusoidal. The
orbital JK light curves have appreciable asymmetry in
quadratures. For example, the J magnitude of Cyg X-1 near the
phase 0.75 is brighter approximately by 0![]() 012 than near the
phase 0.25. The secondary minimum (the X-ray source in front) is
deeper compared to the primary minimum (the optical component in
front). The brightness difference is at least 0
012 than near the
phase 0.25. The secondary minimum (the X-ray source in front) is
deeper compared to the primary minimum (the optical component in
front). The brightness difference is at least 0![]() .02 at
2.2 microns (the K band). The source probably becomes hotter (a
minimum of the J–K color index) at a secondary minimum. After
the correction for the trend, the J–K color index becomes
larger (the source becomes cooler) at all orbital phases.
.02 at
2.2 microns (the K band). The source probably becomes hotter (a
minimum of the J–K color index) at a secondary minimum. After
the correction for the trend, the J–K color index becomes
larger (the source becomes cooler) at all orbital phases.
Thus, it is possible to conclude that in 1995-2007 and 1984-1994 the orbital-phase relations for the J and K magnitudes were similar and can be explained by the model of ellipsoidal variability of an optical star during its orbital motion. It is possible to use the parameters of the binary system derived earlier (Nadzhip et al. 1996) for the observations of 1995-2007.
The mean amplitude of the J and K ellipsoidal variations was
![]() (Table 3). In such a case,
the ratio of average radius of the supergiant in quadratures and
in minima is
(Table 3). In such a case,
the ratio of average radius of the supergiant in quadratures and
in minima is
![]() if the temperature of the
optical component does not change during the orbital motion.
if the temperature of the
optical component does not change during the orbital motion.
If the minimum of the J–K color index near the orbital phase
0.5 (Table 3 and Fig. 2) is real, then the color temperature of
the optical component at this phase is larger approximately by
1000 K than at the phase 0.75. As a result, the radius ratio
![]() will be 1.05.
will be 1.05.
The 294-day Period
The analysis of data from the Vela and Ariel satellites
(1969-1979) permitted to find a period about 300 days in the
X-ray flux from Cyg X-1 (Priedhorsky et al. 1983). Kemp et al.
(1983, 1987) found and carefully studied variations of the
system's optical radiation with the period of 294 days. The
changes of the J and K brightness of Cyg X-1 with the period
![]() and epoch
and epoch
![]() (Kemp et al.
1987) are presented in Fig. 4. The solid and dashed curves are
approximations by fourth-order polynomials, with their confidence
intervals. Thus, a 294-day period with the amplitude
(Kemp et al.
1987) are presented in Fig. 4. The solid and dashed curves are
approximations by fourth-order polynomials, with their confidence
intervals. Thus, a 294-day period with the amplitude
![]() is probably present in the K filter (Fig. 4). The
K-band minimum is at the phase 0.3, it is displaced
approximately by 90 days with respect of the orbital elements from
Kemp et al. (1987).
is probably present in the K filter (Fig. 4). The
K-band minimum is at the phase 0.3, it is displaced
approximately by 90 days with respect of the orbital elements from
Kemp et al. (1987).
We see that the JK variations of the X-ray binary Cyg X-1 in 1995-2007 consisted of at least three components:
- the long-term J and K variations on a time scale years;
- the orbital J and K variations;
- the variations of the J and K magnitudes with a 294-day period.
The JK Brightness of Cyg X-1 Near the Primary Orbital Minimum (the Optical Star in Front)
An estimate of the interstellar extinction. We assume that only the optical component of Cyg X-1, the O9.7Ia supergiant HD 226868, contributes to the radiation in the J and K filters near the primary minimum.
The J–K color index for a normal O9.7 supergiant is
![]() (Koornneef, 1983). The observed index (without a
correction for the trend) near the primary minimum (Table 3a,)
is
(Koornneef, 1983). The observed index (without a
correction for the trend) near the primary minimum (Table 3a,)
is ![]() ,
i.e. the color
excess is
,
i.e. the color
excess is
![]() .
Hence, the
interstellar extinction for Cyg X-1 corresponds to
.
Hence, the
interstellar extinction for Cyg X-1 corresponds to
![]() ,
,
![]() for the normal law of the interstellar
extinction (Koornneef, 1983). If the parameter for Cyg X-1
is 1.3 kpc (Margon et al. 1973), the distance to the star
is
for the normal law of the interstellar
extinction (Koornneef, 1983). If the parameter for Cyg X-1
is 1.3 kpc (Margon et al. 1973), the distance to the star
is ![]() kpc.
kpc.
The color excess after correction for the trend is
![]() and the interstellar extinction is
and the interstellar extinction is
![]() ,
,
![]() , and
, and ![]() kpc.
kpc.
Thus, our estimate of ![]() after
correction for the trend is close to that from photometry
(Karitskaya et al. 2006).
after
correction for the trend is close to that from photometry
(Karitskaya et al. 2006).
Parameters of the optical source from JK observations of
1995-2007. The radius of the source visible near the primary
orbital minimum can be estimated from the equation:
where is the flux calculated for the J magnitude of Cyg X-1 near the primary orbital minimum (Table 3b), corrected for the interstellar extinction; is the flux at 1.25 microns (J) for a black body of the temperature ; is the distance to Cyg X-1. The effective temperature of the O9.7 supergiant was assumed to be
The color index
![]() near the primary
orbital minimum (after correction for interstellar extinction)
corresponds to the source's color temperature
near the primary
orbital minimum (after correction for interstellar extinction)
corresponds to the source's color temperature
![]() K. The radius of such a source will be 25 .
K. The radius of such a source will be 25 .
The long-term component. The difference between the
J–K color indices not corrected and corrected for the trend
(Table 3a,b) corresponds to a variation range of color
temperatures of (22000-26000) K near the primary orbital minimum.
Such changes of the color temperature should lead, for example, to
a change of the J brightness by more than
![]() , the radius
of the source being constant. The observed changes (Table 3) do
not exceed 0
, the radius
of the source being constant. The observed changes (Table 3) do
not exceed 0![]() .05-0
.05-0![]() 07. In this case, a temperature increase
of the supergiant by (4000-5000) K, for the observed increase of
the J-band brightness by approximately 0
07. In this case, a temperature increase
of the supergiant by (4000-5000) K, for the observed increase of
the J-band brightness by approximately 0![]() .05, should be
accompanied with a decrease of its radius approximately by
5-6% and an increase of its luminosity by a factor of 1.5-2.
Thus, the long-term variation component in the J and K
radiation from Cyg X-1 can be explained with changes of
temperature, radius, and brightness of the hot supergiant on a
time scale about 11.5 years.
.05, should be
accompanied with a decrease of its radius approximately by
5-6% and an increase of its luminosity by a factor of 1.5-2.
Thus, the long-term variation component in the J and K
radiation from Cyg X-1 can be explained with changes of
temperature, radius, and brightness of the hot supergiant on a
time scale about 11.5 years.
4. CONCLUSIONS
The JK variations of the X-ray binary Cyg X-1 in 1995-2007 consist of at least three components:
-
The J and K brightness variations due to the orbital
motion. The orbital changes of the J and K brightness are
almost sinusoidal. The orbital JK light curves possess
appreciable asymmetry in quadratures. For example, the J
magnitude of Cyg X-1 near the phase 0.75 is approximately by
0012 brighter than near the phase 0.25. The secondary minimum
(the X-ray source in front) is deeper, compared to the primary
minimum (the optical component in front). The brightness
difference is at least 002 at 2.2 μm (the K band). The
source probably becomes hotter (a minimum of the J–K color
index) at the secondary minimum. The color index J–K becomes
larger at all orbital phases, i.e. the source becomes cooler,
after correction for the trend.
- The long-term J and K brightness variations, on a time scale about 11.5 years.
-
The J and K brightness variations with a 294-day period.
The amplitude is
 in the K filter. The minimum of
the K brightness is at the phase 0.3, it is shifted by
approximately 90 days with respect of the orbital elements from
Kemp et al. (1987).
in the K filter. The minimum of
the K brightness is at the phase 0.3, it is shifted by
approximately 90 days with respect of the orbital elements from
Kemp et al. (1987).
The two last conclusions need verification, and thus it is necessary to continue near-IR photometry of Cyg X-1.
Acknowledgements: This study was supported by the Russian Foundation for Basic Research (grant No. 06-02-16843).
References:
Bowyer, S., Byram, E.T., Chubb, T.A., Friedmann, H., 1965, Science, 147, 394
Brocksopp, C., Tarasov, A.E., Lyuty, V.M., Roche, P., 1999, Astron. and Astrophys., 343, 861
Johnson, H.L., Mitchell, R.I., Iriarte, B., Wisniewski, W.Z., 1966, Comm. Lunar and Planet. Lab., 4, 99
Karitskaya, E.A., Lyuty, V.M., Bochkarev, N.G. et al., 2006, Inform. Bull. Var. Stars, No. 5678
Kemp, J.C., Herman, L.C., Barbour, M.S., 1978, Astron. J., 83, 962
Kemp, J.C., Barbour, M.S., Henson, G.D., et al., 1983, Astrophys. J., 271, L65
Kemp, J.C., Karitskaya, E.A., Kumsiashvili, M.I., et al., 1987, Soviet Astronomy, 31, 170
Koornneef, J., 1983, Astron. and Astrophys., 128, 84
Leahy, D.A., Ananth, A.G., 1992, Monthly Notices Roy. Astron. Soc., 256, 39
Lyutyi, V. M., 1972, IAU Circulars, No. 2395
Lyutyi, V.M., Syunyaev, R.A., Cherepashchuk, A.M., 1973, Soviet Astronomy, 17, 1
Margon, B., Bowyer, S., Stone, R.P.S., 1973, Astrophys. J., 185, L113
Nadzhip, A.E., Khruzina, T.S., Cherepashchuk, A.M., Shenavrin, V.I., 1996, Astronomy Reports, 40, 338
Priedhorsky, W. C., Terrell, J., 1982, Bull. Amer. Astron. Soc., 14, 618
Priedhorsky, W.C., Terrell, J., Holt, S.S., 1983, Astrophys. J., 270, 233
Tananbaum, H., Gursky, H., Kellogg, E., et al., 1972, Astrophys. J., 177, L5
Vacca, W.D., Garmany, C.D., Shull, J.M., 1996, Astrophys. J., 460, 914
Webster, B.L., Murdin, P., 1972, Nature, 235, 37