|
Peremennye Zvezdy (Variable Stars) 26, No. 3, 2006 Received 27 February; accepted 25 March.
|
Article in PDF |
Photometric observations of Supernovae 2000E, 2001B, 2001V, and 2001X
D. Yu. Tsvetkov
Sternberg Astronomical Institute, 13, University Ave., Moscow 119992, Russia, e-mail: tsvetkov@sai.msu.su
|
CCD |
Introduction
Continuing the long-term program of supernova (SN) observations at Sternberg Astronomical Institute, we carried out photometry of bright SNe 2000E, 2001B, 2001V, and 2001X.
SN 2000E was discovered by Valentini et al. (2000) at magnitude
![]() =14.3 on CCD images obtained with the Teramo 0.72-m TNT
telescope on January 26.73 UT. SN was located at
=14.3 on CCD images obtained with the Teramo 0.72-m TNT
telescope on January 26.73 UT. SN was located at
![]() (equinox
2000.0), which is
(equinox
2000.0), which is
![]() west and
west and
![]() south of the
center of the Sbc galaxy NGC 6951. Turatto et al. (2000) reported
that spectra obtained with the 1.8-m telescope at Cima Ekar on
January 27.83 UT indicated that SN 2000E was a type Ia event, few
days before maximum light. CCD photometry of this SN was reported
by Vinko et al. (2001) and Valentini et al. (2003).
south of the
center of the Sbc galaxy NGC 6951. Turatto et al. (2000) reported
that spectra obtained with the 1.8-m telescope at Cima Ekar on
January 27.83 UT indicated that SN 2000E was a type Ia event, few
days before maximum light. CCD photometry of this SN was reported
by Vinko et al. (2001) and Valentini et al. (2003).
The discovery of SN 2001B was reported by Xu and Qiu (2001) on
behalf of Beijing Astronomical Observatory SN survey on January
3.61 UT at magnitude 15.5, estimated from an unfiltered CCD image.
The SN was located at
![]() (equinox 2000.0), which is
(equinox 2000.0), which is
![]() west and
west and
![]() south of the nucleus of the Sc galaxy IC 391. Chornock
and Filippenko (2001) reported that spectra of SN 2001B, obtained
on January 23 with the Shane 3-m reflector at Lick Observatory,
revealed that the object was probably a type Ib SN, roughly one
week past maximum brightness.
south of the nucleus of the Sc galaxy IC 391. Chornock
and Filippenko (2001) reported that spectra of SN 2001B, obtained
on January 23 with the Shane 3-m reflector at Lick Observatory,
revealed that the object was probably a type Ib SN, roughly one
week past maximum brightness.
SN 2001V was discovered by P. Berlind on February 19.38 UT with
the F.L. Whipple Observatory's 1.5-m telescope (Jha et al., 2001).
The following precise position was determined for SN 2001V:
![]() (equinox 2000.0), which is
(equinox 2000.0), which is
![]() east and
east and
![]() north of
the nucleus of the edge-on Sb galaxy NGC 3987. The spectrum of
the SN exhibited a blue continuum with broad features, identifying
this as a type Ia SN well before maximum light. Photometry of SN
2001V was later reported by Vinko et al. (2003).
north of
the nucleus of the edge-on Sb galaxy NGC 3987. The spectrum of
the SN exhibited a blue continuum with broad features, identifying
this as a type Ia SN well before maximum light. Photometry of SN
2001V was later reported by Vinko et al. (2003).
The discovery of SN 2001X was reported by Li et al. (2001) on
behalf of Beijing Astronomical Observatory SN survey. The object
was found (magnitude about 17.0) on an unfiltered image taken
with the BAO 0.6-m telescope on February 27.8 UT. SN 2001X was
located at
![]() (equinox 2000.0), which is
(equinox 2000.0), which is
![]() west and
west and
![]() south of the nucleus of the Sbc galaxy NGC
5921. Chornock et al. (2001) reported that a spectrum of SN 2001X,
obtained with the Lick Observatory Shane 3-m telescope on March
3.5 UT under poor conditions, showed a very blue continuum with
strong H Balmer lines, indicating that it was a type-II SN before
maximum light.
south of the nucleus of the Sbc galaxy NGC
5921. Chornock et al. (2001) reported that a spectrum of SN 2001X,
obtained with the Lick Observatory Shane 3-m telescope on March
3.5 UT under poor conditions, showed a very blue continuum with
strong H Balmer lines, indicating that it was a type-II SN before
maximum light.
Observations and reductions
Our observations were carried out with the 60-cm reflector of Crimean Observatory of Sternberg Astronomical Institute (C60) using a SBIG ST-7 CCD camera and with the 30-cm refractor (M30) and 70-cm reflector (M70), both having SBIG ST-6 cameras, in Moscow. All reductions and photometry were made using IRAF.1
The color terms for transformation of instrumental magnitudes
![]() to standard
to standard ![]() were determined for different
observing seasons and telescope-filter-detector combinations
using observations of standards in M 67 (Chevalier and Ilovaisky,
1991) and in NGC 7790 (Stetson, 2000). The equations
were determined for different
observing seasons and telescope-filter-detector combinations
using observations of standards in M 67 (Chevalier and Ilovaisky,
1991) and in NGC 7790 (Stetson, 2000). The equations
![]() were solved for color terms, which are listed
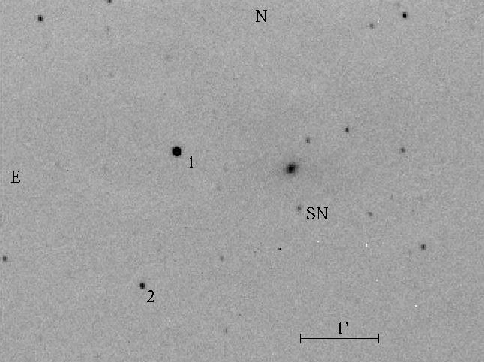
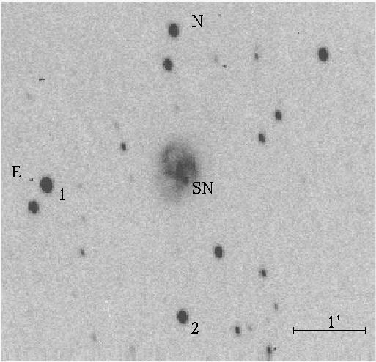
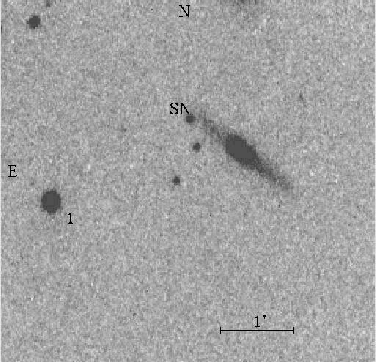
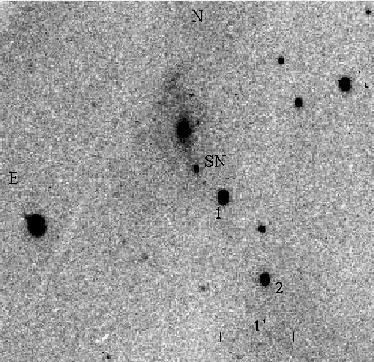
in Table 1. The images of the SNe with comparison stars are shown
in Figs. 1-4. The magnitudes of comparison stars were determined
on photometric nights, when we observed standards from Landolt
(1992) and standard regions in the clusters M 67, NGC 7790, and
M 92 (http://cadcwww.hia.nrc.ca/cadcbin/wdb/astrocat/stetson/query/NGC6341).
were solved for color terms, which are listed
in Table 1. The images of the SNe with comparison stars are shown
in Figs. 1-4. The magnitudes of comparison stars were determined
on photometric nights, when we observed standards from Landolt
(1992) and standard regions in the clusters M 67, NGC 7790, and
M 92 (http://cadcwww.hia.nrc.ca/cadcbin/wdb/astrocat/stetson/query/NGC6341).
Some magnitude estimates for comparison stars were obtained
during observations of SNe, but they were verified later, in
2002-2004, using observations with C60 and M70 equipped with CCD
cameras Apogee AP-7p and Ap-47p; Roper Scientific VersArray1300B.
Final values for magnitudes of comparison stars were determined
by averaging data from 5-8 nights; they are presented in Table
2, where the designations of stars consist of the galaxy name and
the star number on the chart.
Photometric measurements of the SNe were made relative to comparison stars using PSF-fitting with IRAF DAOPHOT package. The background of host galaxies around SNe was quite smooth in most cases, which was not surprising, taking into account high focal ratios of our telescopes. Subtraction of images of host galaxies, obtained when SNe were no longer detectable, was applied in some cases for SNe 2001B and 2001X, and the results were found virtually identical to those obtained without subtraction. The results of SNe observations are presented in Tables 3-6, and the light curves are shown in Figs. 5-8.
Results and conclusions
SN 2000E. The light curves are shown in Fig. 5. They appear
typical for SN Ia, the data are in a good agreement with the
template light curves of SN Ia 1991T (Lira et al., 1998), except
that the decline rate at late stages for SN 2000E is higher than
for SN 1991T. Our magnitudes are in a good agreement with the
results of Valentini et al. (2003) and Vinko et al. (2001).
However, our ![]() magnitude of comparison star 1 differs
significantly from the value given by Vinko et al. (2001):
magnitude of comparison star 1 differs
significantly from the value given by Vinko et al. (2001):
![]() . The magnitudes of the SN at maximum light and at
the inflection point can be determined:
. The magnitudes of the SN at maximum light and at
the inflection point can be determined:
![]() on JD
2451577,
on JD
2451577,
![]() on JD 2451579,
on JD 2451579,
![]() on JD 2451577,
on JD 2451577,
![]() on JD 2451575,
on JD 2451575, ![]() on
JD 2451607. SN 2000E had quite slow decline past maximum:
on
JD 2451607. SN 2000E had quite slow decline past maximum:
![]() ,
, ![]() mag/day,
mag/day, ![]() , but the
rate of decline after the inflection point was close to the mean
values for SNe Ia:
, but the
rate of decline after the inflection point was close to the mean
values for SNe Ia:
![]() .
.
SN 2000E clearly suffered significant extinction both in our
Galaxy and in the host galaxy. The Galactic extinction in the
direction of NGC 6951 is ![]() according to Schlegel et al.
(1998), but Burstein and Heiles (1982) gave a much smaller value,
according to Schlegel et al.
(1998), but Burstein and Heiles (1982) gave a much smaller value,
![]() . Valentini et al. (2003) reported that the interstellar
NaI D lines in the spectrum of SN 2000E, which originated in the
host galaxy, had the equivalent width EW(NaI)
. Valentini et al. (2003) reported that the interstellar
NaI D lines in the spectrum of SN 2000E, which originated in the
host galaxy, had the equivalent width EW(NaI)![]() 0.6 Å.
According to Turatto et al. (2003), this value of EW(NaI) may
correspond to color excess
0.6 Å.
According to Turatto et al. (2003), this value of EW(NaI) may
correspond to color excess ![]() from 0
from 0![]() 1 to 0
1 to 0![]() 3. So,
using these data, we can estimate the total reddening of SN 2000E
to lie between 0.32 and 0.70. Comparing the
3. So,
using these data, we can estimate the total reddening of SN 2000E
to lie between 0.32 and 0.70. Comparing the ![]() color curve
of SN 2000E with the color curves for SNe Ia with negligible
extinction in host galaxies, we can estimate
color curve
of SN 2000E with the color curves for SNe Ia with negligible
extinction in host galaxies, we can estimate
![]() .
Valentini et al. (2003) adopted
.
Valentini et al. (2003) adopted ![]() as the most likely
value, after considering different methods for its determination.
If we take this value for reddening and the distance modulus
as the most likely
value, after considering different methods for its determination.
If we take this value for reddening and the distance modulus
![]() from LEDA (http://leda.univ-lyon1.fr/), which
was computed using the radial velocity of the host galaxy,
corrected for Virgocentric flow, and
from LEDA (http://leda.univ-lyon1.fr/), which
was computed using the radial velocity of the host galaxy,
corrected for Virgocentric flow, and ![]() km
s
km
s![]() Mpc
Mpc![]() , then we obtain for the absolute magnitude of
SN 2000E
, then we obtain for the absolute magnitude of
SN 2000E
![]() . This is clearly brighter than
the average value for SNe Ia and confirms the relation between
rate of decline and absolute magnitude for SNe Ia (Pskovskii,
1977, Phillips, 2005).
. This is clearly brighter than
the average value for SNe Ia and confirms the relation between
rate of decline and absolute magnitude for SNe Ia (Pskovskii,
1977, Phillips, 2005).
SN 2001B. The light curves are shown in Fig. 6, where we
also plotted the data reported by amateur astronomers at
http://www.astrosurf.com/snweb2/2001/01B_/01B_Meas.htm.
Their results are in satisfactory agreement with our data, and we
can assume that the peak of ![]() -band light curve is correctly
determined by observations of amateurs. Supposing the
-band light curve is correctly
determined by observations of amateurs. Supposing the ![]() light
curve had the same shape of the peak, we fitted it to the
light
curve had the same shape of the peak, we fitted it to the ![]() -band
light curve of SN Ib 1983N (Cappellaro et al., 1995), and the
agreement seems quite satisfactory. We can estimate the
magnitudes at maximum light:
-band
light curve of SN Ib 1983N (Cappellaro et al., 1995), and the
agreement seems quite satisfactory. We can estimate the
magnitudes at maximum light:
![]() on JD 2451929,
on JD 2451929,
![]() on approximately the same date. The rate of
linear decline after the inflection point was
on approximately the same date. The rate of
linear decline after the inflection point was ![]() mag/day both in
mag/day both in ![]() and
and ![]() bands. It is difficult to estimate
extinction in the host galaxy for SN 2001B because color curves
of type Ib/c SNe have considerable scatter. However, in this case
we can suppose that it was not large, because reports on
spectroscopic observations did not mention noticeable NaI
interstellar lines and the
bands. It is difficult to estimate
extinction in the host galaxy for SN 2001B because color curves
of type Ib/c SNe have considerable scatter. However, in this case
we can suppose that it was not large, because reports on
spectroscopic observations did not mention noticeable NaI
interstellar lines and the ![]() color near maximum was quite
blue:
color near maximum was quite
blue:
![]() . Adopting the distance
. Adopting the distance ![]() from LEDA
and Galactic extinction
from LEDA
and Galactic extinction ![]() from Schlegel et al. (1998),
we derive
from Schlegel et al. (1998),
we derive ![]() , which is close to the mean value for SN
Ib/c (Richardson et al., 2002)
, which is close to the mean value for SN
Ib/c (Richardson et al., 2002)
SN 2001V. The light curves, presented in Fig. 7, can be
matched closely by those for SN 1991T. Our data are in a good
agreement with the results by Vinko et al. (2003), only in the ![]() band some systematic difference can be noticed. Our magnitudes for
comparison star 1 are in excellent agreement with data by Vinko
et al. (2003), with maximum difference of only 0
band some systematic difference can be noticed. Our magnitudes for
comparison star 1 are in excellent agreement with data by Vinko
et al. (2003), with maximum difference of only 0![]() 01. The
magnitudes at maximum light can be determined from template curve
fitting, as there was a gap in observations near maximum:
01. The
magnitudes at maximum light can be determined from template curve
fitting, as there was a gap in observations near maximum:
![]() .
The time of maximum in
.
The time of maximum in ![]() was about JD 2451974. SN 2001V was
clearly a slowly declining SN Ia, but as the maximum was not
covered with observations, we do not attempt to derive
was about JD 2451974. SN 2001V was
clearly a slowly declining SN Ia, but as the maximum was not
covered with observations, we do not attempt to derive
![]() but estimate only
but estimate only ![]() . This value is
similar to that for SN 2000E. The extinction for SN 2001V is very
small both in our Galaxy and in the host galaxy: Galactic
. This value is
similar to that for SN 2000E. The extinction for SN 2001V is very
small both in our Galaxy and in the host galaxy: Galactic
![]() according to Schlegel et al. (1998), and the
according to Schlegel et al. (1998), and the ![]() color curve does not show any significant reddening. Vinko et al.
(2003) derived the total reddening
color curve does not show any significant reddening. Vinko et al.
(2003) derived the total reddening ![]() . Adopting this
value and the distance modulus
. Adopting this
value and the distance modulus ![]() from LEDA, we obtain
from LEDA, we obtain
![]() - the same values as for SN 2000E. Thus,
the photometric characteristics of these two SNe Ia are nearly
identical.
- the same values as for SN 2000E. Thus,
the photometric characteristics of these two SNe Ia are nearly
identical.
SN 2001X. This SN was certainly a type II-P event, as can
be seen from Fig. 8, where we also plotted data obtained by
amateur astronomers in the bands close to ![]() and
and ![]() from http://www.astrosurf.com/snweb2/2001/01X_/01X_Meas.htm. Most
of their magnitudes are in good agreement with our results. The
light curves are fitted with those for the typical SN II-P 1999gi
(Leonard et al., 2002). We can estimate
from http://www.astrosurf.com/snweb2/2001/01X_/01X_Meas.htm. Most
of their magnitudes are in good agreement with our results. The
light curves are fitted with those for the typical SN II-P 1999gi
(Leonard et al., 2002). We can estimate
![]() on JD
2451974,
on JD
2451974,
![]() .
The plateau phase lasted approximately until JD 2452077, that is
about 103 days, which is a quite typical value for type II-P SNe.
The Galactic extinction in the direction of SN 2001X amounts to
.
The plateau phase lasted approximately until JD 2452077, that is
about 103 days, which is a quite typical value for type II-P SNe.
The Galactic extinction in the direction of SN 2001X amounts to
![]() according to Schlegel et al. (1998). Comparison of
the
according to Schlegel et al. (1998). Comparison of
the ![]() color curve for SN 2001X with that for SN 1999gi
allows us to conclude that the reddening of SN 2001X in the host
galaxy was negligible. Adopting
color curve for SN 2001X with that for SN 1999gi
allows us to conclude that the reddening of SN 2001X in the host
galaxy was negligible. Adopting ![]() from LEDA, we estimate
from LEDA, we estimate
![]() , close to the mean value for SN II-P (Richardson
et al., 2002).
, close to the mean value for SN II-P (Richardson
et al., 2002).
The results of our study show that all the studied SNe are typical for their classes considering the shape of their light curves and their absolute magnitudes at maximum.
Acknowledgements: This research made use of the Lyon-Meudon Extragalactic Database (LEDA) and of the Canadian Astronomy Data Centre. The author is grateful to V.P. Goranskij, S.Yu. Shugarov, and I.M. Volkov for help in the observations. The work was partly supported by grant 05-02-17480 from the Russian Foundation for Basic Research.
References:
Burstein, D., Heiles, C., 1982, Astron. J., 87, 1165
Cappellaro, E., Turatto, M., Fernley, J., 1995, IUE - ULDA Access Guide No. 6, ESA Publications Division, ESTEC, Noordwijk, The Netherlands
Chevalier, C., Ilovaisky, S.A., 1991, Astron.& Astrophys. Suppl. Ser., 90, 225
Chornock, R., Filippenko, A.V., 2001, IAU Circ., No. 7577
Chornock, R., Li, W.D., Filippenko, A.V., 2001, IAU Circ., No. 7593
Jha, S., Matheson, T., Challis, P., Kirshner, R., Berlind, P., 2001, IAU Circ., No. 7585
Landolt, A., 1992, Astron. J., 97, 337
Leonard, D.C., Filippenko, A.V., Li, W., et al., 2002, Astron. J., 124, 2490
Li, W., Fan, Y., Qiu, Y.L., Hu J.Y., 2001, IAU Circ., No. 7591
Lira, P., Suntzeff, N.B., Phillips, M.M., et al., 1998, Astron. J., 116, 1006
Phillips, M.M., 2005, in 1604-2004: Supernovae as cosmological lighthouses, M. Turatto et al., eds., ASP Conf. Ser., 342, 211
Pskovskii, Yu.P., 1977, Soviet Astron., 21, 675
Richardson, D., Branch, D., Casebeer, D. et al., 2002, Astron. J., 123, 745
Schlegel, D., Finkbeiner, D., Davis, M., 1998, Astrophys. J., 500, 525
Stetson, P., 2000, Publ. Astron. Soc. Pacif., 112, 925
Turatto, M., Benetti, S., Cappellaro, E., 2003: From Twilight to Highlight: The Physics of Supernovae, B. Leibundgut & W. Hillebrandt, eds., Proc. ESO/MPA/MPE Workshop, 200
Turatto, M., Galletta, G., Cappellaro, E., 2000, IAU Circ., No. 7351
Valentini, G., Di Carlo, E., Guidubaldi, D., et al., 2000, IAU Circ., No. 7351
Valentini, G., Di Carlo, E., Massi, F. et al., 2003, Astrophys. J., 595, 779
Vinko, J., Csak, B., Csizmadia, S. et al., 2001, Astron.& Astrophys., 372, 824
Vinko, J., Biro, I.B., Csak, B. et al., 2003, Astron.& Astrophys., 397, 115
Xu, D.W., Qiu, Y.L., 2001, IAU Circ., No. 7555
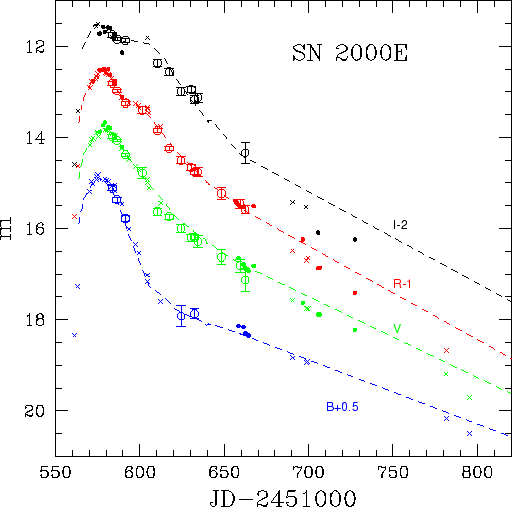 |
Fig. 5.
The |
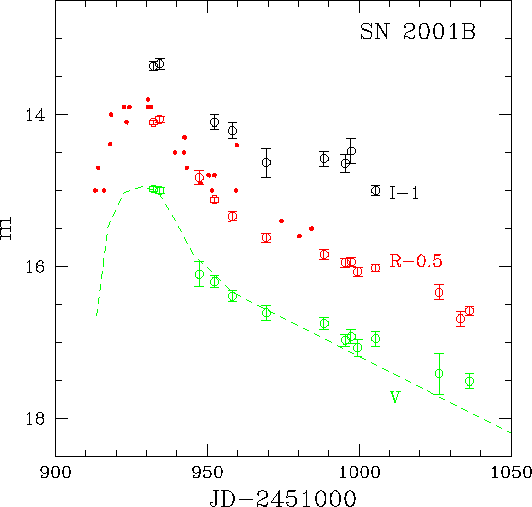 |
Fig. 6.
The |
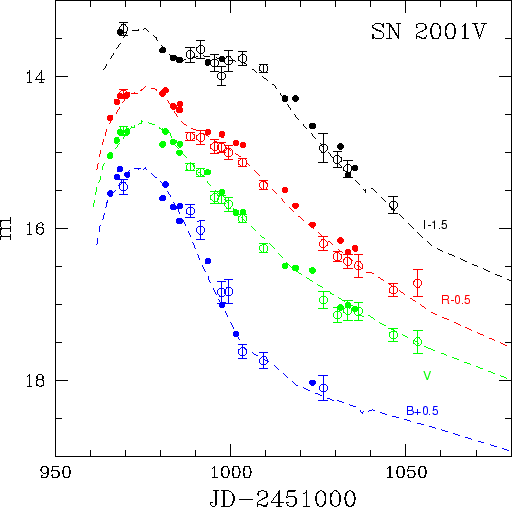 |
Fig. 7.
The |
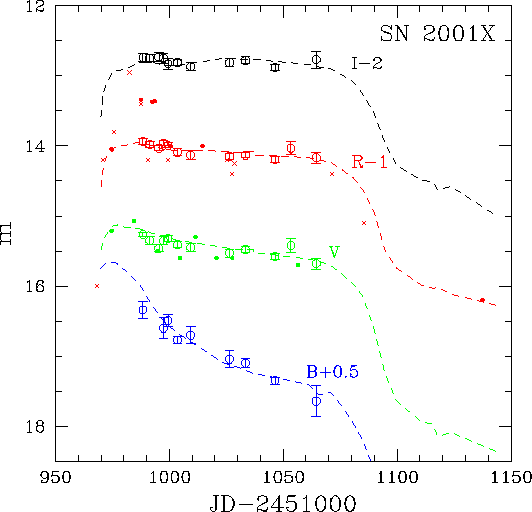 |
Fig. 8.
The |
| Star | ||||||||
| NGC6951-1 | 14.35 | 0.02 | 12.61 | 0.02 | 11.67 | 0.02 | 10.86 | 0.03 |
| NGC6951-2 | 15.75 | 0.04 | 14.91 | 0.02 | 14.36 | 0.04 | 13.91 | 0.04 |
| IC391-1 | 14.01 | 0.08 | 13.24 | 0.02 | 12.85 | 0.01 | 12.50 | 0.04 |
| IC391-2 | 14.85 | 0.10 | 14.07 | 0.03 | 13.66 | 0.02 | 13.21 | 0.06 |
| NGC3987-1 | 13.08 | 0.05 | 12.23 | 0.01 | 11.74 | 0.01 | 11.27 | 0.03 |
| NGC5921-1 | 13.22 | 0.03 | 11.99 | 0.01 | 11.33 | 0.01 | 10.71 | 0.03 |
| NGC5921-2 | 13.51 | 0.04 | 12.90 | 0.02 | 12.57 | 0.02 | 12.24 | 0.05 |
| JD 2450000+ | Tel. | ||||||||
| 1583.62 | 14.61 | 0.06 | 13.98 | 0.04 | 13.81 | 0.04 | 13.75 | 0.06 | C60 |
| 1586.61 | 14.87 | 0.05 | 14.07 | 0.02 | 13.98 | 0.04 | 13.84 | 0.04 | C60 |
| 1591.60 | 15.28 | 0.07 | 14.38 | 0.03 | 14.25 | 0.04 | 13.87 | 0.04 | C60 |
| 1601.60 | 14.78 | 0.12 | 14.40 | 0.07 | M30 | ||||
| 1610.60 | 15.63 | 0.08 | 14.85 | 0.05 | 14.37 | 0.08 | M30 | ||
| 1617.57 | 15.74 | 0.05 | 15.24 | 0.04 | 14.56 | 0.07 | M30 | ||
| 1624.57 | 17.42 | 0.23 | 16.00 | 0.09 | 15.50 | 0.08 | 14.99 | 0.09 | M30 |
| 1630.58 | 16.20 | 0.08 | 15.66 | 0.06 | 14.95 | 0.07 | M30 | ||
| 1632.53 | 17.37 | 0.11 | 16.19 | 0.06 | 15.76 | 0.05 | 15.17 | 0.09 | M30 |
| 1634.53 | 16.29 | 0.13 | 15.76 | 0.10 | 15.13 | 0.10 | M30 | ||
| 1648.39 | 16.63 | 0.17 | 16.23 | 0.13 | M30 | ||||
| 1659.41 | 16.82 | 0.15 | 16.46 | 0.10 | M30 | ||||
| 1662.40 | 17.13 | 0.26 | 16.58 | 0.09 | 16.34 | 0.24 | M30 |
| JD 2450000+ | Tel. | ||||||||
| 1932.29 | 15.27 | 0.15 | 14.98 | 0.03 | 14.60 | 0.03 | 14.36 | 0.06 | M30 |
| 1934.30 | 14.94 | 0.18 | 15.00 | 0.04 | 14.56 | 0.04 | 14.33 | 0.07 | M30 |
| 1947.30 | 16.10 | 0.17 | 15.33 | 0.09 | M30 | ||||
| 1952.32 | 16.20 | 0.08 | 15.62 | 0.03 | 15.10 | 0.10 | M30 | ||
| 1958.25 | 16.39 | 0.07 | 15.84 | 0.06 | 15.21 | 0.10 | M30 | ||
| 1969.39 | 16.61 | 0.10 | 16.12 | 0.06 | 15.63 | 0.19 | M30 | ||
| 1988.41 | 16.75 | 0.08 | 16.34 | 0.07 | 15.58 | 0.10 | M30 | ||
| 1995.40 | 16.97 | 0.08 | 16.45 | 0.06 | 15.64 | 0.12 | M30 | ||
| 1997.31 | 16.92 | 0.09 | 16.44 | 0.06 | 15.48 | 0.16 | M30 | ||
| 1999.55 | 17.07 | 0.11 | 16.57 | 0.06 | M30 | ||||
| 2005.41 | 16.95 | 0.10 | 16.52 | 0.05 | 16.00 | 0.07 | M70 | ||
| 2026.31 | 17.41 | 0.27 | 16.84 | 0.10 | M70 | ||||
| 2033.35 | 17.19 | 0.10 | M70 | ||||||
| 2036.32 | 17.51 | 0.10 | 17.08 | 0.06 | M70 |
| JD 2450000+ | Tel. | ||||||||
| 1969.55 | 14.95 | 0.10 | 14.71 | 0.06 | 14.73 | 0.06 | 14.87 | 0.09 | M30 |
| 1988.47 | 15.27 | 0.09 | 15.19 | 0.05 | 15.29 | 0.05 | 15.21 | 0.10 | M30 |
| 1991.45 | 15.52 | 0.12 | 15.26 | 0.05 | 15.30 | 0.09 | 15.14 | 0.12 | M30 |
| 1995.45 | 15.59 | 0.08 | 15.42 | 0.09 | 15.32 | 0.11 | M30 | ||
| 1997.40 | 16.34 | 0.14 | 15.62 | 0.05 | 15.43 | 0.07 | 15.49 | 0.12 | M30 |
| 1999.44 | 16.33 | 0.16 | 15.68 | 0.09 | 15.50 | 0.09 | 15.29 | 0.14 | M30 |
| 2003.47 | 17.12 | 0.09 | 15.87 | 0.05 | 15.63 | 0.05 | 15.26 | 0.09 | M70 |
| 2009.41 | 17.24 | 0.11 | 16.26 | 0.06 | 15.93 | 0.06 | 15.39 | 0.05 | M70 |
| 2026.37 | 17.60 | 0.16 | 16.94 | 0.11 | 16.70 | 0.09 | 16.44 | 0.19 | M70 |
| 2030.32 | 17.14 | 0.10 | 16.87 | 0.07 | 16.59 | 0.10 | M70 | ||
| 2033.41 | 17.08 | 0.13 | 16.93 | 0.09 | 16.71 | 0.11 | M70 | ||
| 2036.41 | 17.09 | 0.12 | 16.99 | 0.15 | M70 | ||||
| 2046.34 | 17.40 | 0.09 | 17.31 | 0.09 | 17.19 | 0.11 | M70 | ||
| 2053.38 | 17.49 | 0.15 | 17.22 | 0.18 | M30 |
| JD 2450000+ | Tel. | ||||||||
| 1988.57 | 15.84 | 0.12 | 15.26 | 0.03 | 14.94 | 0.04 | 14.74 | 0.06 | M30 |
| 1991.50 | 15.35 | 0.06 | 14.98 | 0.05 | 14.75 | 0.06 | M30 | ||
| 1995.51 | 15.46 | 0.05 | 15.03 | 0.04 | 14.73 | 0.06 | M30 | ||
| 1997.46 | 16.10 | 0.15 | 15.35 | 0.05 | 14.96 | 0.04 | 14.75 | 0.07 | M30 |
| 1999.50 | 15.99 | 0.08 | 15.32 | 0.04 | 14.99 | 0.04 | 14.83 | 0.08 | M30 |
| 2003.51 | 16.27 | 0.06 | 15.41 | 0.04 | 15.09 | 0.05 | 14.81 | 0.05 | M70 |
| 2009.53 | 16.20 | 0.12 | 15.45 | 0.06 | 15.13 | 0.06 | 14.87 | 0.06 | M70 |
| 2026.46 | 16.54 | 0.12 | 15.53 | 0.06 | 15.15 | 0.04 | 14.81 | 0.06 | M70 |
| 2033.46 | 16.60 | 0.07 | 15.48 | 0.04 | 15.13 | 0.04 | 14.78 | 0.05 | M70 |
| 2046.43 | 16.85 | 0.06 | 15.58 | 0.04 | 15.19 | 0.04 | 14.88 | 0.05 | M70 |
| 2053.42 | 15.42 | 0.10 | 15.03 | 0.09 | M30 | ||||
| 2064.40 | 17.14 | 0.22 | 15.68 | 0.08 | 15.17 | 0.08 | 14.77 | 0.12 | M30 |
Footnotes
- ... IRAF.1 IRAF is distributed by the National Optical Astronomy Observatory, which is operated by AURA under cooperative agreement with the National Science Foundation